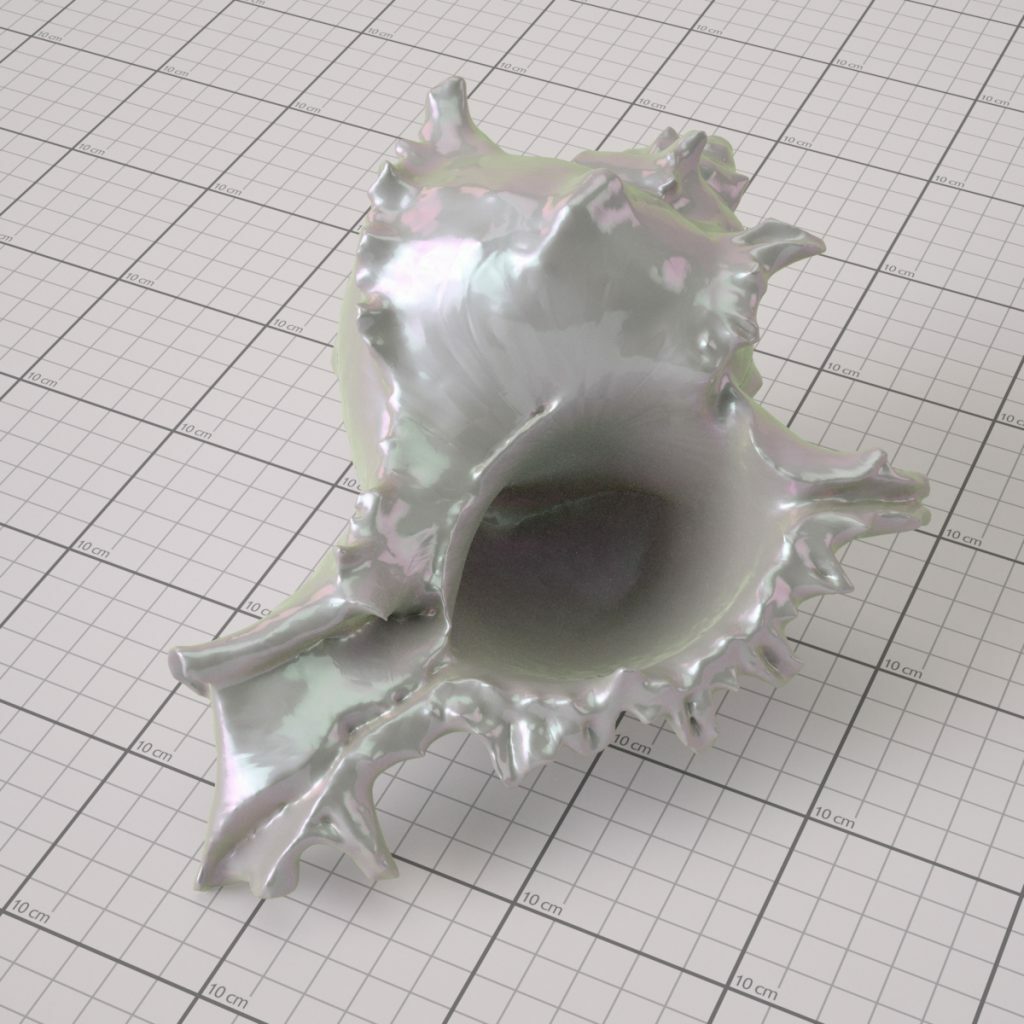


Figure 1 – Rendered nacre material in Ocean™

Figure 2 – 15° to 90° picture of the real sample, observing light interactions and surface topology

Figure 3 – Examples of some reference images where light interactions and the iridescence effect are clearly visible, similar to the figure 2 real sample observation.

Figure 4 – FYI: Electron microscopy image of fractured nacre surface. It is composed of mineral and organic layers. (Public domain image)

Figure 5 – This image shows the different parts and details of the zones that can be visually interesting to create a good material « simulation ».

Figure 6 – The texture result of the nacre surface simulation. In the 3 noise patterns : the lighter the pixels are the more they simulate high areas and the darker they are the more they represent deep or hollow areas. Transformed into a normal map where RGB (Red, Green,Blue) colors correspond to the respective X, Y and Z coordinates of surface normals. This normal map is used in the Ocean™ bump node.

Figure 7 – Using a CAD software to preview the result of the normal map applied on a plane with an environment image for the lighting simulation.

Figure 5 – Creation of the iridescence blend map that is used for the color distribution observed on the sample.

Figure 9 – Ocean™ Shader for the nacre material. White/green/pink Lobe bsdf distribution within the greyscale gradient blending map image.

Responses