Introduction
One of the current topics of research in the world of agronomy is the study of agricultural greenhouses with the aim of optimizing the amount of light entering the greenhouse to maximise the agricultural yield.
This article will cover a collaborative service, known as luminance study, between AGCulture & Eclat Digital. It aims at quantifying the amount of light that reaches the ground and crops in a greenhouse in Tampere, Finland. The amount of incoming light, and in particular its distribution on the ground, is directly affected by the glazing used on the rooftop of the greenhouse. The main objective being to maximize the agricultural yield, and so to maximize the quantity of light reaching the ground, several glass configurations are studied.
Moreover, considering the variation of light intensity along the seasons, several time periods are considered for exhaustivity purposes.
To assess this, Oceanâ„¢, developed by Eclat Digital, is used. It is a spectral ray tracer that provides high accuracy illumination calculations. Thanks to its specific spectral features, it allows a highly physically accurate description of materials and provides physically true predictive images. Relying on a valid and strong physical approach, it guarantees a perfect match between renders and real world and can therefore be used for assessing the quantity of light entering a building, for instance passing through glazing structures and reaching the ground of a greenhouse.
In this blog article, we focus on certain composition of glass but be aware that these studies can be run on every type of glasses.
Technical requirements
Lighting conditions
Glasses
In this article, we’ll study 10 different glass compositions. The glass compositions are made of anti-reflective (AR) coating, etching and substract (see Figure 1). Thus, required data are:
- AR coating reflectance and transmittance spectra.
- Etching, corresponding to the microscopic state of surface. We have several levels. This etching is supposed to homogenize the light distribution at ground, which is useful to increase the light in shadow areas (shadows coming from the metallic framing). An example of etching effect is shown in Figure 2.
- We need the reflectance and transmittance spectra, and the thickness of the measured sample.

Figure 1 - Glazing composition Schema

Figure 2 - Example of a glass with a medium state of surface. The etching affects the 'through vision' of the glass, which becomes blurred.
Greenhouse specifications
The greenhouse is modelled by an Eclat Digital 3D graphist (see Figure 3). Here are the dimensions to match the average building standards:
- Height between 6.5 – 7m from ground level to gutter,
- Bay size 4m gutter to gutter,
- Section size 5m truss to truss,
- Roof bars 1.25 or 1.67m.
In this study, one of the objectives is to obtain the distribution of light at ground level. Crop foliage will induce a shadow, and we need to take this into account to well assess the quantity of light. For this, we also model tomato crops. We got the average height of a tomato plant (4.5m), and the distance from the ground to where the leaves start to growing (1m). See figure 4.

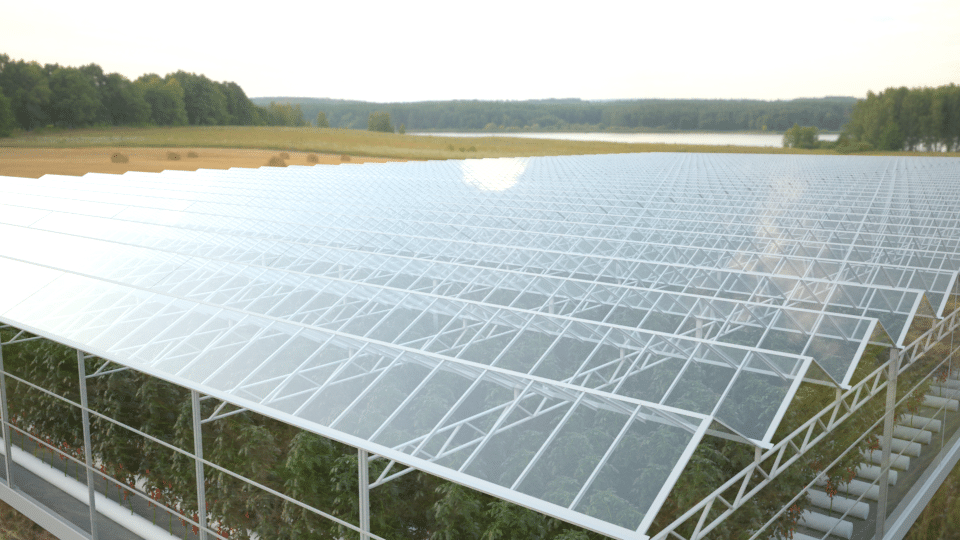
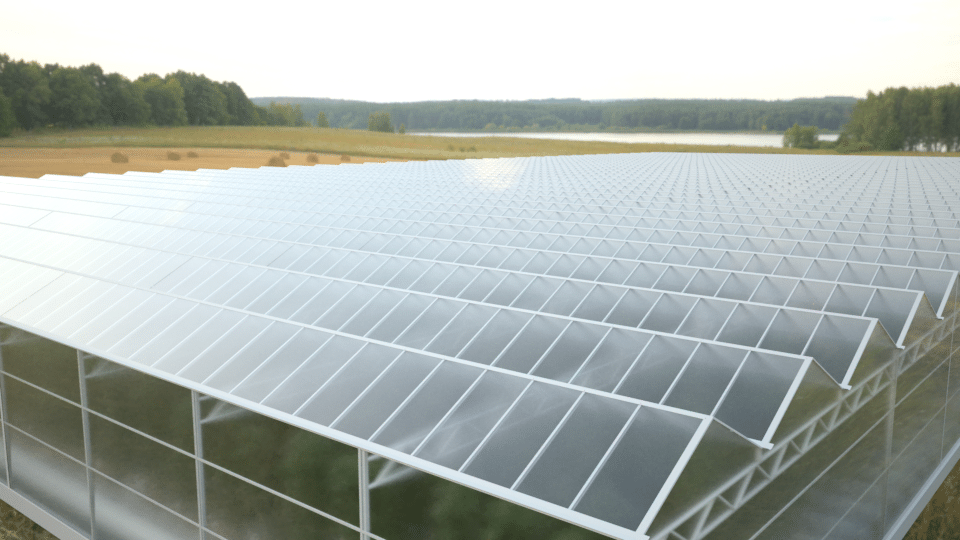
Figure 3 - Greenhouse modelling. Top left: top view with the long and wide dimensions. Bottom left: front view with the height dimensions. Right: Perspective view with the green tubes for the tomato plants.

Figure 4 - Modelling and positioning of tomato crops.
Points of view
This study can be split in two parts. The first one consists in evaluating the quantity of light entering the greenhouse, and the second one consists in evaluating the aestheticism of the greenhouse.
To carry out these two evaluations, we need two types of Oceanâ„¢ cameras:
- A perspective camera, which allows us to evaluate the aestheticism of the greenhouse. Two POV are set, one from the inside of the greenhouse, and one from the outside of the greenhouse.
- A probe camera (irradiance camera in OceanTM), which allows us to evaluate the quantity of light entering the greenhouse. Two POV are set, one corresponding to a top view and one corresponding to a perspective view from the inside of the greenhouse.
Analysis
Irradiance simulation over a day
Let us now switch to the analysis part. We first begin with the analysis of simulations made for a given hour (12 o’clock) the 21st of June. We present in Figure 5 a top irradiance view of the greenhouse, for three different compositions of glazing: a clear glass, a double AR glass and a High etching glass.
Figure 5 - Top irradiance view simulation for three different compositions of glazings. From let to right: clear, double AR and high etching glass.
With the Pixel Infos tool of Oceanâ„¢, we can define areas of interest: the total surface seen in Figure 5, an area corresponding to a hotspot zone, and two areas corresponding to a shadow zone (coldspot zones, named shadow and grazing angle). Then, we measure the irradiance, i.e. the quantity of light arriving in these areas. The irradiance for each area and each composition of glass is presented in Figure 6.

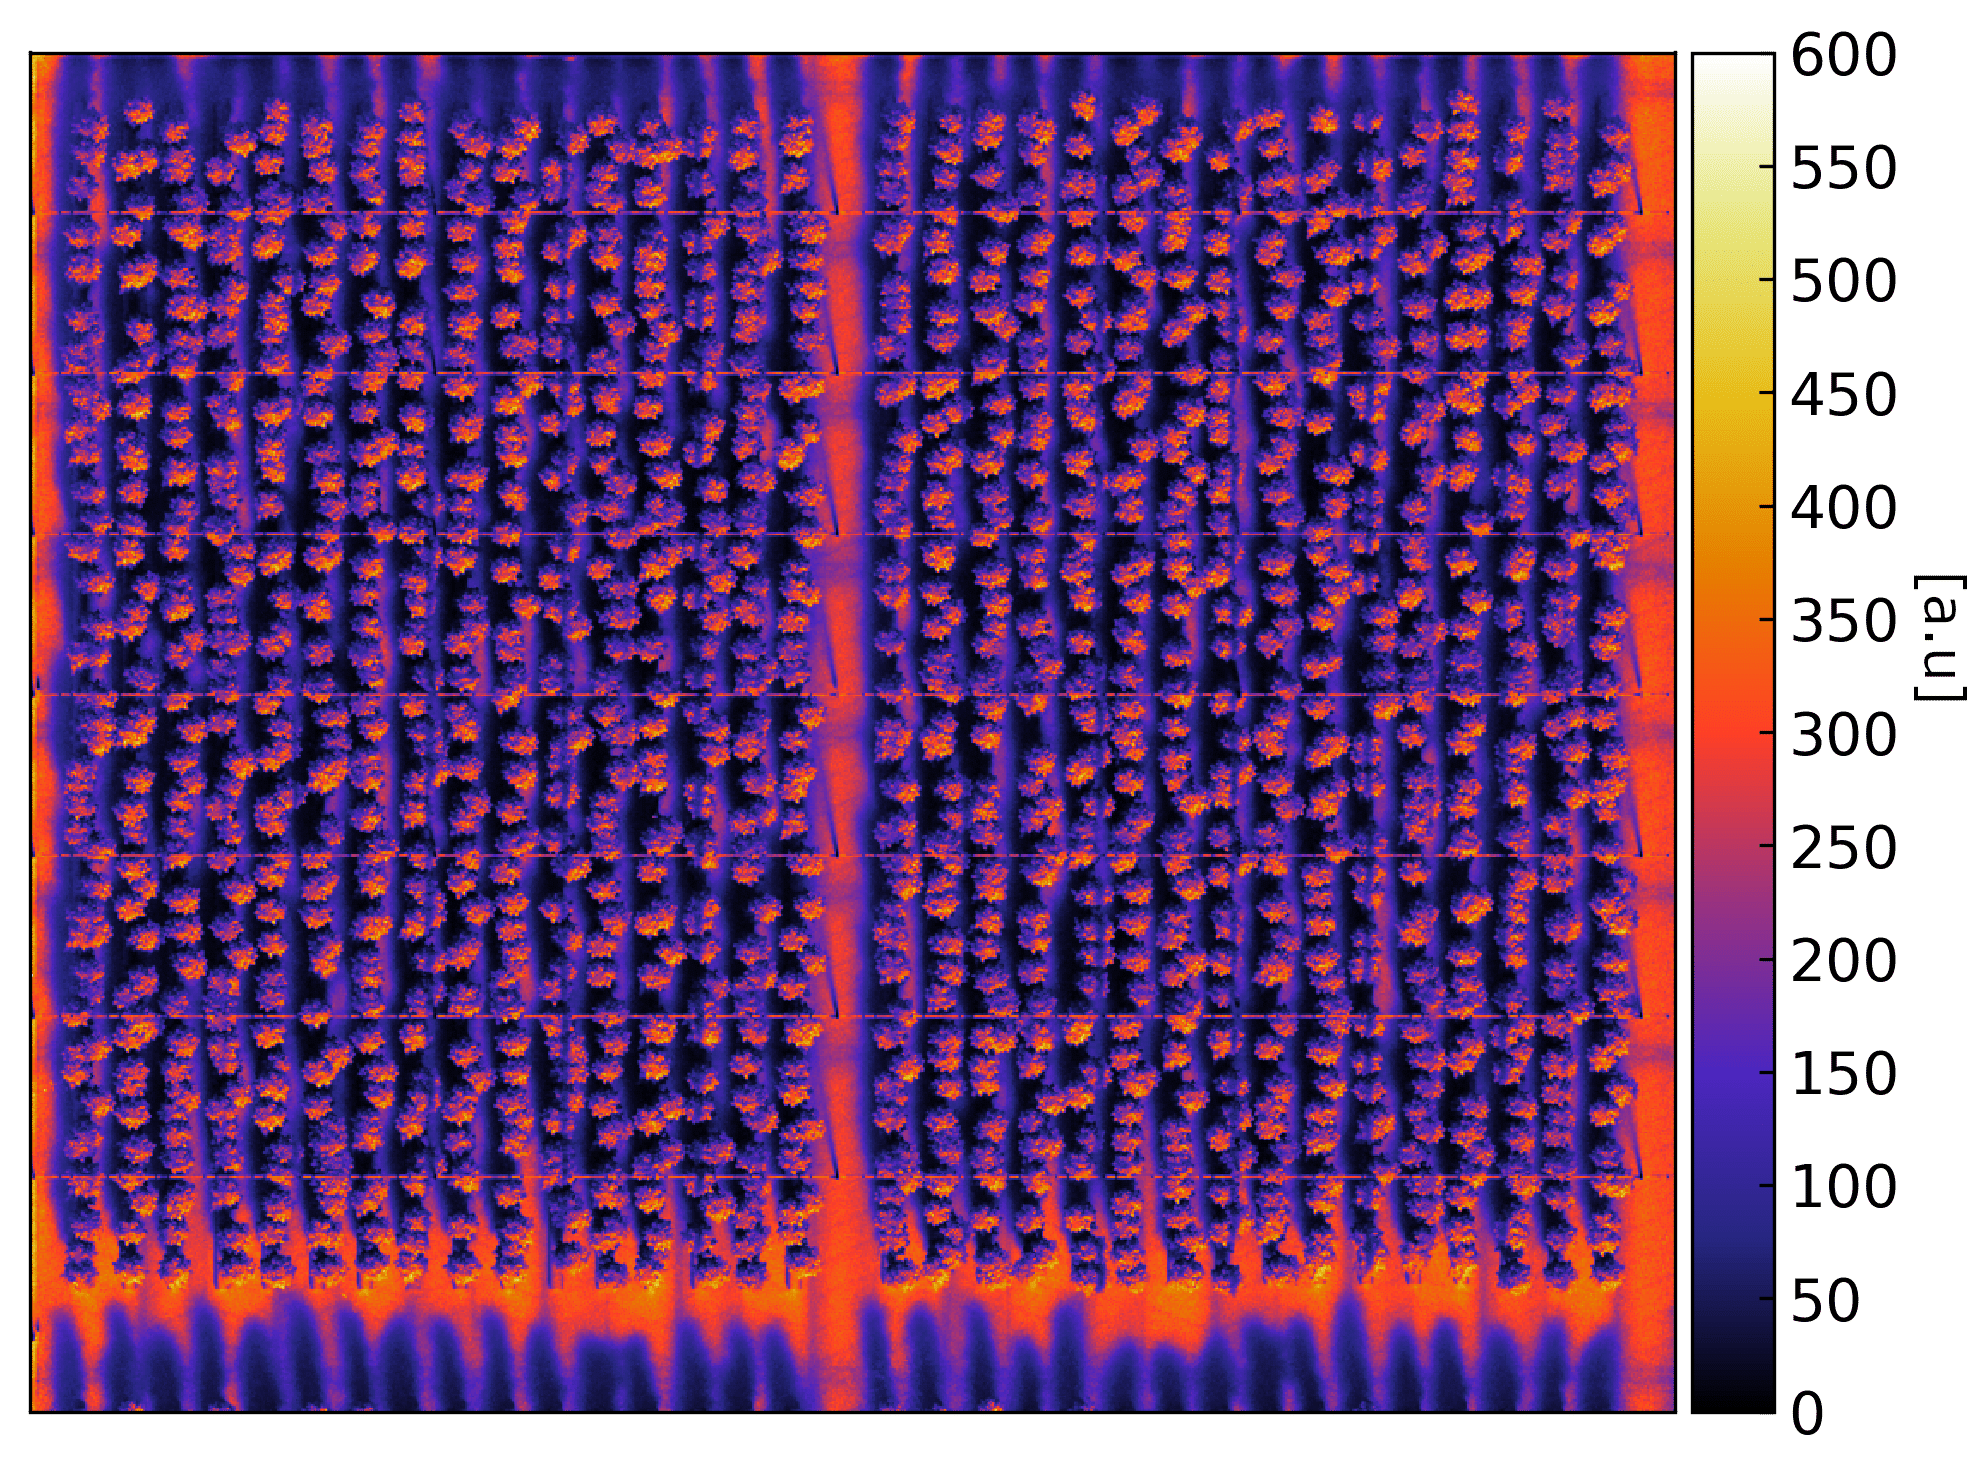
Figure 6 - Irradiance per area for each composition of glass.
Let us now analyze the irradiance by area of interest :
- Total area (black bar) : we can split the analysis in two parts. First, we focus on the impact of the anti-reflective (AR) coating. As the name suggests, this coating aims at decreasing the quantity of light reflected by the glass surfaces, and so to let pass more light through the glass. We clearly see its impact when comparing the irradiance of the clear glass (335 au) with the irradiance of the double AR glass (351 au), corresponding to roughly 5% of increase.
- Hotspot area (cyan bar) : the hotspot area irradiance follows the same behaviour as the total area irradiance. Indeed, the irradiance increases when using two AR coating (difference between clear and double AR glasses). Then, as light is increasingly scattered as the etching level increases, the irradiance of hotspot area, corresponding to a light concentration, decreases as the etching level increases (since the light is less concentrated).
- Coldspot areas (green and grey bars) : finally, as mentioned in the introduction, the objective is to maximize the quantity of light reaching the ground of the greenhouse. As we can see on the several simulations (Figure 5 and Figure 7), the greenhouse structure induce shadow on crops (darkest forms), which may lead to a decrease in their yield. As previously discussed, the etching is supposed to diffuse homogenously the light and thus to increase it in shadow areas. This is what we can see if we observe the green and grey bars in Figure 6. Indeed, between the double AR glass and the highest level of etching glass, the irradiance increases from 254 au to 306 au. The impact of the etching can also be observed in Figure 6, where we see sharp forms induced by the framing for clear and double AR glass simulations (top and middle images), and faded shadows on the highest level of etching glass simulation (bottom images).
Figure 7 - Top irradiance view simulation for three different compositions of glazings. From top to bottom: clear, double AR and high etching glass.
The previous analysis is made on a single hour for a single day. This is suitable to show the impact of double AR or etching, but this is probably not representative. Indeed, it could be interesting to have this kind of information over a long period, for instance over a season or the complete year. In the following, we present results obtained for a complete year.
Note: in this article, we have chosen to not deal with a specific condition in the greenhouse. Indeed, depending on the weather, a thin film of water can be present on the inner face of the rooftop glazing, inducing a minimisation of the etching effect. Therefore, it is important to proceed to this kind of study over a long period of time, to be as representative as possible.
Irradiance simulation over a year
Figure 8 - Over year irradiance simulation with clear glass. left : perspective irradiance view, Right : Top irradiance view
To proceed to these simulations, we have added up all the hourly skies together. This means that the weather condition used for these simulations contains around 4800 suns in the sky (corresponding to the number of hours in a year when the sun is above the horizon). This directly leads to a blurring of shadows on the ground, as we see in Figure 8.
In figure 9, we present the yearly irradiance for the different compositions of glass. As for the hourly simulations, we clearly see the impact of the double AR coating (from 516008 au to 540275 au). Then, we also clearly see the impact of etching: from 540275 au for double AR coating glass to 524609 au for the highest level of etching glass.

Figure 9 - Irradiance per area for each composition of glass.
Aesthetic renders
Associated to the irradiance analysis, we also simulate the aesthetics of the greenhouse in its environment (figure 9).Â
Figure 9 - Aesthetics simulation. Left column : Clear Glass, Right column : High etching Glass
Conclusion
In this article, we have presented a use case of a greenhouse study in collaboration with AGCulture. We have shown that depending on the composition of the glazing, it is possible to maximize the quantity of light entering the greenhouse (use of double AR coating), and to optimize the light distribution inside it (use of etching).
This type of study shows the range of possibilities for simulations with OceanTM, for example to produce aesthetic renderings or to obtain precise quantification information (radiance, irradiance…). It also shows that OceanTM can deal with huge 3D model. Indeed, in this case, the greenhouse area is equal to around 14,000 m², corresponding to roughly 14,000 pieces of glass for the rooftop. Moreover, taking into account crops leads to 2,000 tomato plants with 110 tomatoes each.
We have discussed of several topics, from the creation of the lighting condition to the Pixel Infos tool. Articles have already been published on these different subjects, and we invite you to refer to them if you want more information.
Meet us at BAU 2025
Responses