Introduction
In this article, we propose a quantitative study of the light distribution inside a car using the spectral ray tracer software, Ocean™. More precisely, the study will focus on the direct and indirect lighting coming from door emitters.
A complete 3D car model (OEM based model) will be used and we will focus on the conductor’s door, as shown in figure 1.

Figure 1 - CAD Model of the car used for the lighting study
It is noteworthy to consider the whole vehicle instead of selected parts in order to take into account all lighting contributions coming from both the exterior environment and interior material reflections. Indeed, several parameters may influence the lighting distribution inside the car cabin and need to be considered :
- Material properties of specific car components can be expected to impact the global light distribution, e.g. emitter cover cap, dashboard plastic, metallic components. Those materials are defined with spectral BRDF (Bidirectional Reflectance Distribution Function), either from analytical model, either from measurements.
- Environment: Exterior lighting contribution is expected to impact the global light distribution (Figure 2). Environment are defined with spherical light radiance distribution, either from mathematical models either captured (environment map) associated with horizontal luminance value (in lux). In this study, night and day environment maps will be considered. Besides, the optical properties of the light which pass through elements (glazing and car body) are also expected to have an impact and need to be considered.

Figure 2 - Lighting conditions on the considered car. Light from the exterior of the car (environment) as well as interior lighting contribution are taking into account.
Door lighting configuration
Light sources will be described based on three main parameters :
· Light intensity : Light intensity is defined as a radiative energy or photometric value. It can be described with an emittance spectrum(W/m²/m) or renormalized with an integrated value (W – lumen, …).
· Light shape : The light profile can be defined as an hemispherical distribution. For this study, the function will be reduced as a polar distribution (symmetrical by rotation). IES file can also be directly imported and used in Ocean™ :

Figure 3 - IES Examples
- Emission spectrum : The light emission spectrum can be defined in multiple way. Here some examples :
- Tabulated data (e.g. measured LED spectrum)
- Temperature spectrum (blackbody radiation spectrum)
- Any colorimetric coordinates (e.g., RGB, Lab, XYZ, …)
- Reference illuminant (e.g., D65, A, TL84,…)

Figure 4 - Example of light emission with different blackbody temperature radiation
Each of these parameters may have an impact on the lighting distribution inside the car and on the passenger’s experience as well.
Several light configurations will be shown in this article. The goal here is to demonstrate that moving from one configuration to another is easy while using Ocean™ allowing to make several tests on several configurations which can be needed to make a decision while developing interior lighting.
Workflow and results
Pocket door
The illumination of the pocket door is studied with two scenario (shown in figure 3) :
- One point-like source placed under the armrest (figure 3a)
- One strip source placed under the armrest (figure 3b)


Figure 5 - Pocket door illumination (a) with a point-like source and (b) with a strip source
The goal was to find the best compromise between an evenly lighting of the pocket door while limited the quantity of light reaching the ground of the car. Several tests were made, based on the LED geometrical shape (point like source or band source), the LED spread angle (from 20° to 120°) and the LED intensities. Three different point of view and day and night environments were provided to appreciate the pocket door illumination. With an automatic used of Ocean™ (see fig 4), all test and results (108 totals) were obtain in one night (14h of simulation time).
Finally, two outputs were provided, one aesthetic image (fig 5) and one irradiance quantification (fig 6), allowing to measure the quantity of light reaching the sensor.

Figure 6 - Ocean™ render project. Allowing to automatically render simulations.

Figure 7 - Example of Aesthetic render (LED with spread angle of 20°)

Figure 8 - Example of irradiance simulation (Scenario 1 with night environment)
Door illumination
Strip sources are placed behind the door that is composed of a diffusive plastic
The goal here is to evenly illuminate the door. In this case, the parameters that will be modified is the number of lights and the distance between the lights and the door (shown in figure 9). In the same way, both aesthetic and quantitative render are provided.

Figure 9 - Door panel illumination scenario. d is the distance between LED and the door panel.

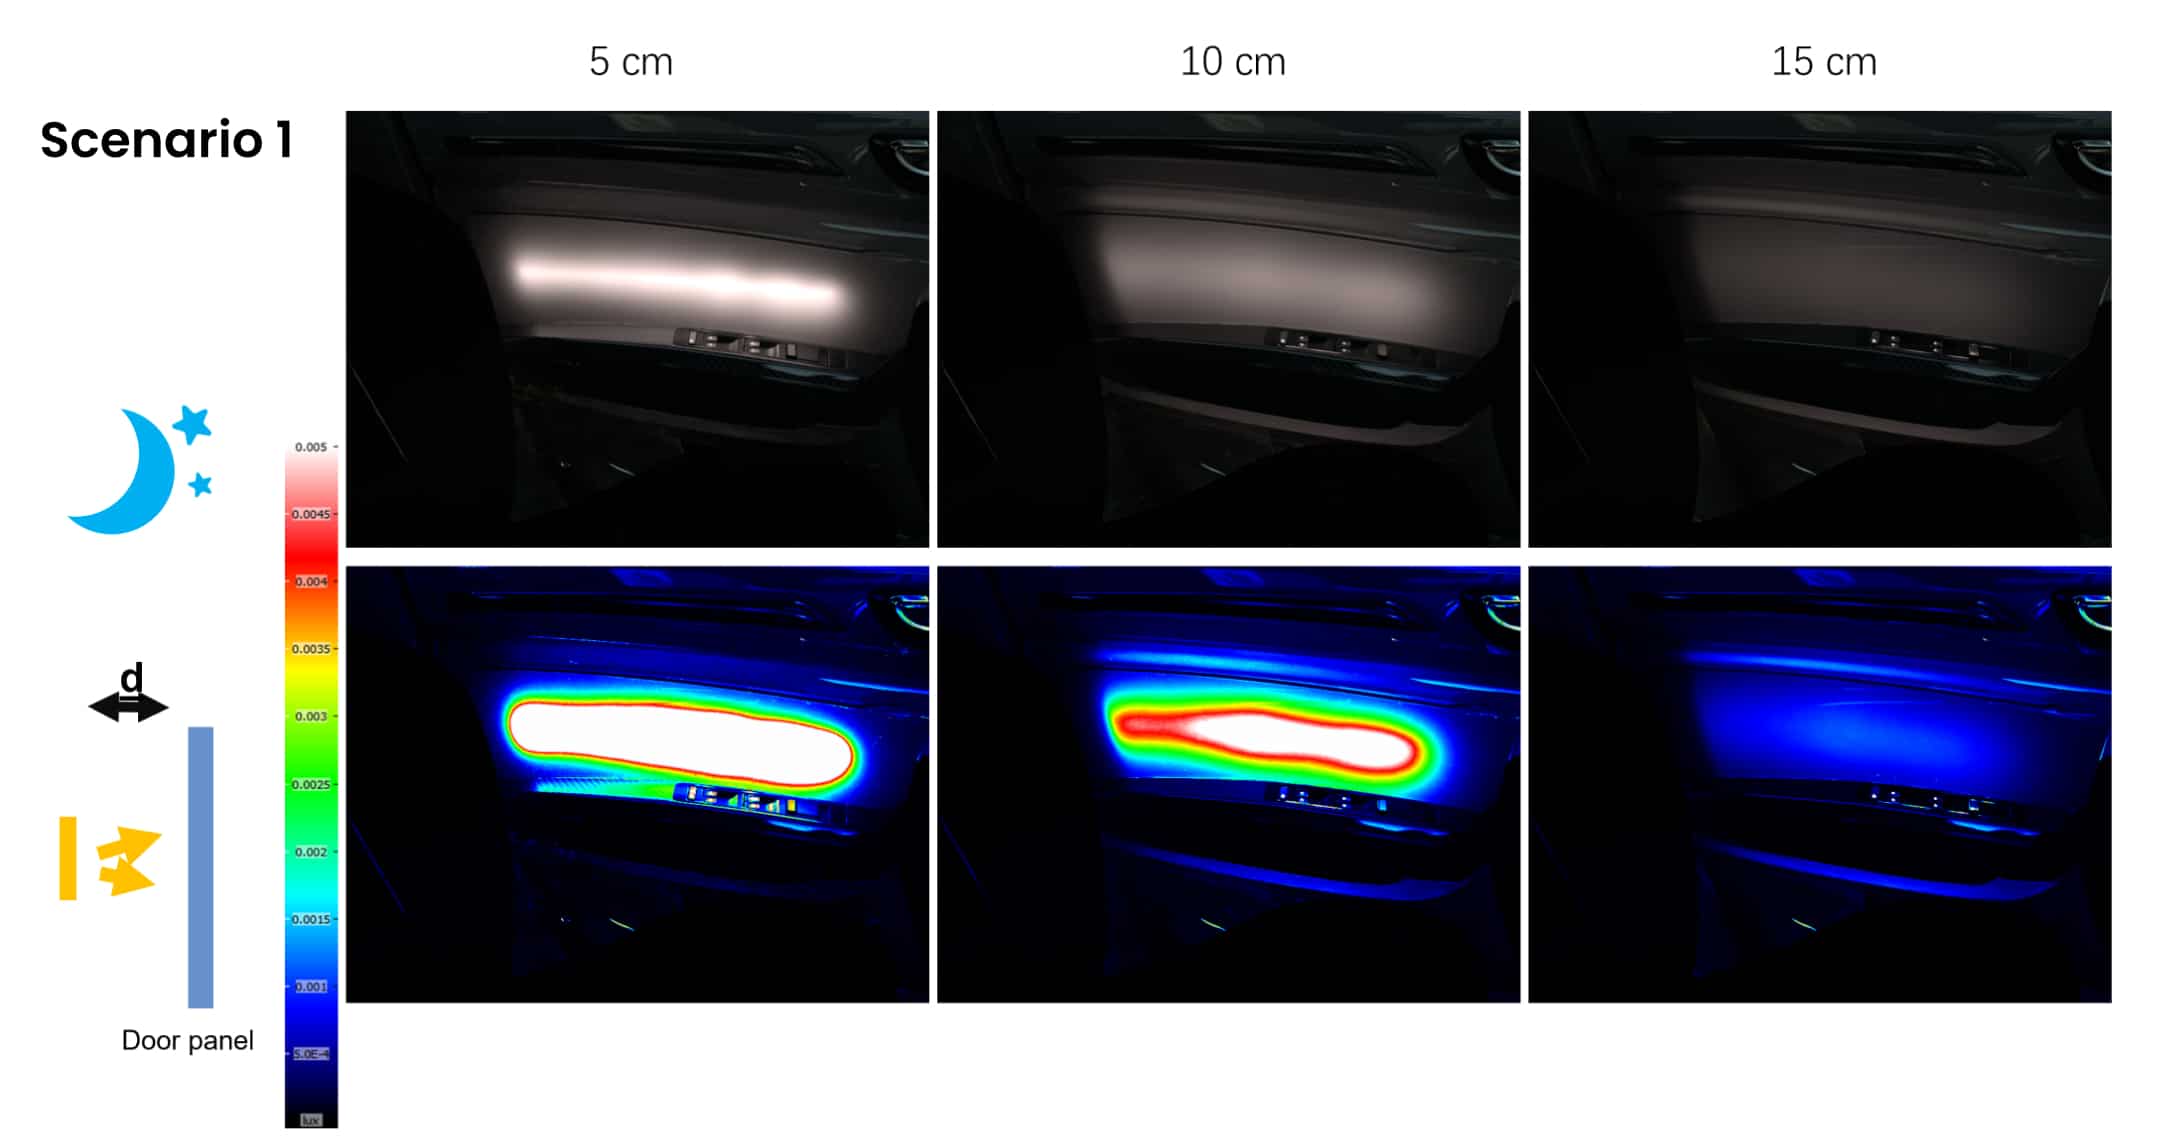
Figure 10 - Door illumination. One light at different distance to the door. Aesthetic and quantitative renders.

Figure 11 - Door illumination. Three lights at different distance to the door. Aesthetic and quantitative renders.
Finally, with three lights bands placed at 15 cm away from the door, the color of the LED and the door plastic are modified.

Figure 11 - Door illumination. Three lights at 15 cm to the door. The color of the door plastic and the LED are modify.
Conclusion
In this article, illumination of a pocket door was studied with several light configurations. The goal was to demonstrate that moving from one configuration to another is easy while using Ocean™. Besides, the render project tools box, available in Ocean™, allows to quickly make several tests on several configurations which can be needed to make a decision while developing interior lighting.
Responses